What Is Share of Voice (SOV)? Definition, Importance & How to Calculate It
If you want the straight answer: Share of Voice (SOV) is the percentage of total media spending your brand commands in a specific category, market, channel, and time period. It’s not about how many people see your ads, like your posts, or talk about your product—it’s about how much of the overall “paid presence” you actually buy compared to competitors. (Source: nielsen.com)
Let’s break that down. Imagine you and four competitors are each running ads for sneakers in Berlin this month. If the total ad spend in that market is €1 million and you spend €200,000, your SOV is 20%. Simple math, but the implications run deep.
What Share of Voice Is—and Isn’t
Here’s where people get tripped up: SOV isn’t a measure of brand awareness, impressions, or social buzz. It doesn’t tell you how many people noticed your campaign, or whether they liked it. Those are different metrics—think “brand familiarity” or “engagement.” SOV is strictly about input: the percentage of resources (money, placements) you’re putting into the competitive pool.
Why the Distinction Matters
Why does this matter? Because SOV is a reality check before you even launch a campaign. It answers: “Are we spending enough to be competitive in this channel, right now?” It doesn’t guarantee results (bad creative or wrong timing can still tank a campaign), but it sets the stage for visibility. If your SOV is lower than your share of market (SOM), you’re likely to lose ground over time; if it’s higher, you’re positioned to grow.
In 2026, SOV can be defined narrowly (like Instagram ads in February) or broadly (all national TV spend over a year). The key is clarity: pick your battleground, know your numbers, and don’t confuse SOV with softer metrics like “brand buzz.” It’s a hard, competitive number—a baseline for any serious marketing strategy.
Why Share of Voice Matters in 2026: Impact and Use Cases
Stepping into the world of marketing metrics, it’s easy to get overwhelmed by soft numbers and fuzzy promises. But share of voice (SOV) is different—it’s a hard, competitive line in the sand. If you’ve ever wondered why one brand surges ahead while others stall, SOV is often the missing link. Here’s why it matters in 2026, and how real teams use it to drive decisions.
SOV as a Baseline for Competitiveness
Let’s be blunt: SOV tells you if you’re even in the race. It’s not about how many people like your posts or recognize your logo. SOV is about resource allocation—how much media spending you’re putting into the market, versus what your competitors are doing, on the same battleground. If your SOV is too low, you’re basically whispering while others shout.
Maybe that sounds harsh, but in practice, it’s true. Imagine you’re running paid campaigns for a new product launch. If your media spend is 10% of what the category as a whole is investing, your brand’s presence will be drowned out. SOV is the metric that reveals this before it’s too late.
The SOV–SOM Rule: Growth or Decline
Here’s where it gets interesting (and actionable). Decades of research, including the well-known Binet & Field study, show a direct correlation: brands with extra share of voice (ESOV, meaning SOV > SOM) tend to grow their market share over time. The math isn’t magic; it’s competitive reality. Their research found that for every 10% your SOV exceeds your SOM, you can expect around a 0.5% annual gain in market share.
Flip the equation and the warning is clear: if your SOV lags behind your SOM, you’re likely to lose ground. This isn’t just theory. In our work, we’ve seen brands cut spend, watch their SOV slip, and then scramble as market share erodes six months later. It’s rarely immediate, but the trend is stubborn.
Real-World Use Cases
So, how do savvy marketers use SOV in 2026?
Budget Planning: SOV is a sanity check before you pitch for more spend. If your SOV is below your SOM, you can make a case for more budget—or at least defend against cuts.
Channel Strategy: You can break SOV down by channel—TV, organic search, social media mentions, even AI search (see our AI ChatGPT Visibility guide). This helps you spot where you’re under- or over-invested.
Competitive Analysis: SOV is a scoreboard. If your main competitor is dominating paid search, you’ll see it in the numbers. It’s a wake-up call to adjust tactics, not just hope for better creative.
Forecasting & Scenario Planning: By modeling SOV shifts, you can estimate potential market share changes. It’s not perfect, but it’s more reliable than gut feeling.
Typical Mistakes and Limits
One big mistake: confusing SOV with softer metrics like “share of conversation” or “buzz.” SOV is about media spending and hard presence, not sentiment or reach. Another? Relying on SOV alone. It’s a baseline, not a guarantee—bad creative or poor targeting can still sink a campaign, even with high SOV.
In practice, SOV works best as a strategic compass. Use it to set direction, spot risks, and justify investment, but don’t expect it to do the work of creative or product teams. If you’re not measuring SOV, you’re flying blind in a market that rewards visibility and punishes silence.
Ready to see how your SOV stacks up? Start by mapping your media spend and comparing it to the total category. If the numbers are off, now’s the time to act—before market share moves and you’re left asking what happened.
How Share of Voice Is Calculated: Core Formula and Channel Variants
You might be thinking, “Okay, but how do I actually measure Share of Voice for my brand?” Good question—because if you can’t calculate it, you can’t improve it. Let’s break down the math and see how SOV works across different channels, so you can stop guessing and start acting.
The Core Formula: Simple, but Not Always Obvious
At its heart, Share of Voice (SOV) is a percentage. The universal formula is:
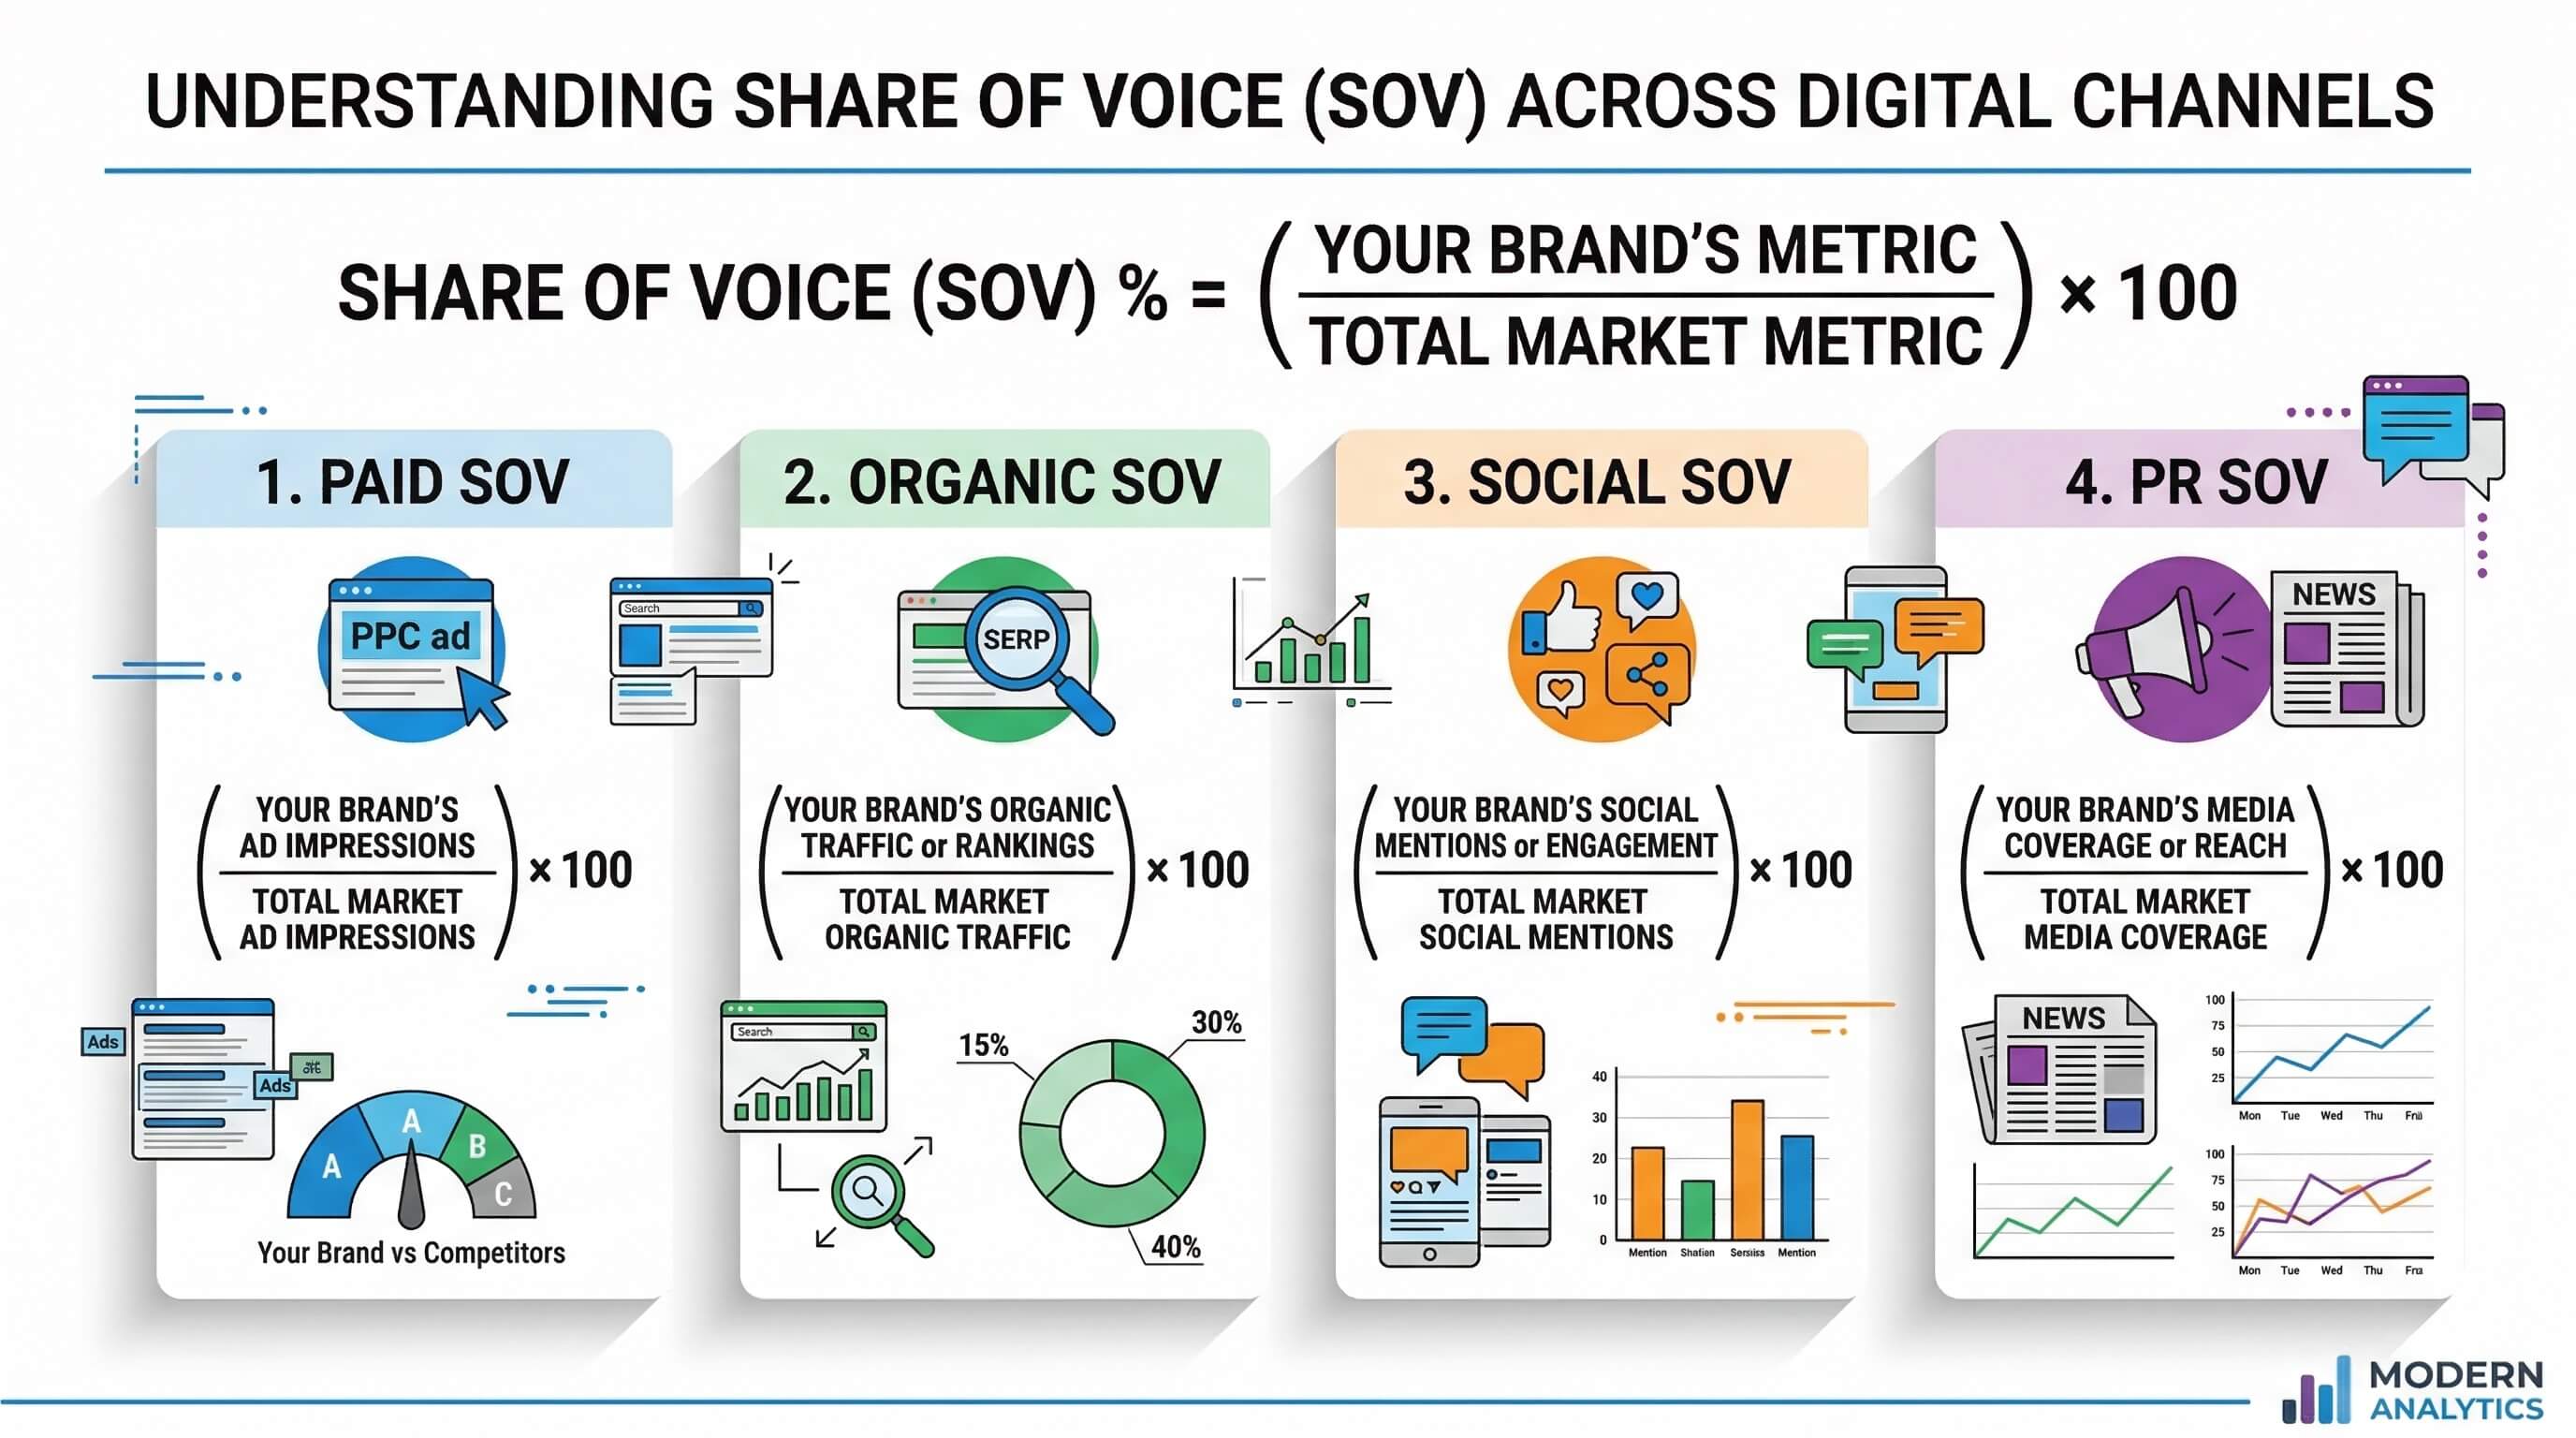
SOV (%) = (Your brand metrics ÷ Total market metrics) × 100
This sounds straightforward, but the real trick is knowing which metrics to use—because “brand metrics” look very different depending on the channel you’re measuring.
For paid media, it’s usually ad spend.
For organic search, it’s search visibility or estimated traffic.
For social, it’s mentions or engagement.
For PR, it’s media coverage or article count.
So, the formula stays the same, but the inputs change. That’s where most teams get tripped up—comparing apples to oranges, or using the wrong denominator.
Channel-by-Channel: What Counts as “Voice”?
Let’s walk through the main marketing channels and what you should measure for each:
Paid Advertising
Brand Metric: Your ad spend (e.g., on Google Ads, TV, or display)
Market Metric: Total ad spend by all brands in your category/region/timeframe
When to use: Budget planning, competitive benchmarking
Example: If you spend $50,000 on Google Ads in your category, and the total category spend is $500,000, your SOV is 10%.
Organic Search (SEO Share of Voice)
Brand Metric: Your share of search visibility (e.g., % of impressions, clicks, or estimated traffic for a keyword set)
Market Metric: Total search visibility for all tracked competitors
When to use: SEO strategy, content planning
Example: Your site earns 12,000 organic clicks for a set of tracked keywords; all competitors combined get 100,000. Your SEO SOV is 12%.
Social Media
Brand Metric: Number of mentions, engagements, or reach
Market Metric: Total mentions/engagements/reach for all brands in your category
When to use: Brand awareness tracking, campaign analysis
Example: Your brand is mentioned 800 times on Instagram in a month; total industry mentions are 8,000. SOV: 10%.
PR & Media Coverage
Brand Metric: Number of media articles or press hits
Market Metric: Total articles/press hits for all brands in your space
When to use: Reputation management, launch tracking
Example: Your product launch gets 15 media articles, while the category gets 150. SOV: 10%.
SOV Calculation Examples by Channel
Channel | Brand Metric Example | Total Market Metric | SOV (%) |
Paid Advertising | $50,000 ad spend | $500,000 | 10 |
Organic Search | 12,000 clicks | 100,000 | 12 |
Social Media | 800 mentions | 8,000 | 10 |
PR/Media | 15 articles | 150 | 10 |
Common Pitfalls and How to Avoid Them
Mixing metrics: Don’t compare your ad spend to competitors’ impressions. Stick to the same metric for both numerator and denominator.
Too narrow or broad: Define your market carefully—wrong boundaries can skew SOV up or down.
Ignoring channel overlap: Some audiences see you in multiple channels; SOV per channel won’t add up to 100% across all channels.
Bottom line: SOV isn’t just a number—it’s a mirror for your competitive landscape. Calculate it right, and you’ll know exactly where you stand.
SEO Share of Voice: Visibility, Measurement, and AI Disruption
So, when we talk about knowing exactly where you stand, let’s get real about what SEO Share of Voice actually measures—and what’s changed in 2026.
What Is SEO Share of Voice—And Why Does It Matter?
At its core, SEO Share of Voice (SOV) is about visibility. It answers a simple question: Out of all the possible organic search results for your target keywords, what proportion does your brand occupy compared to competitors? If you’re picturing a pie, it’s your slice of the Google results page—how often your pages show up, and how prominently.
But here’s the thing: SOV in SEO isn’t about impressions, clicks, or even traffic. It’s about potential—your capacity to be seen when it matters. BrightEdge, who actually patented SOV measurement for organic search, put this on the map for search marketers (see brightedge.com). That means SOV is now a staple metric, not just for paid but for organic, too.
How Is SEO Share of Voice Calculated?
The formula is straightforward, but the devil’s in the details:
SEO SOV (%) = (Your brand’s ranked visibility for tracked keywords ÷ Total ranked visibility for all competitors) × 100
What counts as “visibility”? Usually, it’s a weighted score based on ranking position and search volume—higher ranks and bigger keywords matter more. But here’s a common pitfall: Tools differ wildly in how they define “visibility.” Some only count top 10, some include page 2, some factor in SERP features. If your tool doesn’t clarify this, your SOV number is just a guess.
And, crucially, SOV in SEO is only as good as your keyword set. If you track the wrong terms—too broad, too niche, or not updated for AI trends—you’re not seeing the real picture. We’ve seen brands obsess over a “high” SOV, only to realize their tracked keywords missed half the market’s search intent.
AI Disruption: New Surfaces, New Rules
Now, here’s where the landscape shifts. Until recently, SEO SOV was all about Google’s classic blue links. But with AI, new “surfaces” have arrived:
Google AI Overviews: Your brand might get mentioned in an AI summary, even if you don’t own a blue link. That mention is part of your SOV now—but it’s harder to track, and not all tools can do it.
ChatGPT, Perplexity, and other AI search tools: These platforms show brand mentions in their answers. But in 2026, they account for less than 1% of all search referrals (BrightEdge AI Market Pulse). Organic search is still the main event, driving over 90% of traffic.
So, should you care about AI SOV? Yes—but don’t panic. AI search is mainly a discovery channel for now. People ask questions, gather info, then go back to Google or direct to your site to convert.
Limits and Misconceptions
Let’s get clear about what SEO SOV cannot do:
It doesn’t measure conversions or revenue—just visibility.
It’s not a proxy for brand awareness or market share (though there’s a correlation if tracked over time).
It can be gamed by tracking uncompetitive or irrelevant keywords.
Most tools lag behind in measuring AI surfaces, so your “AI SOV” is likely incomplete.
In practice, SEO Share of Voice works if—and only if—you use it as a directional compass, not a scoreboard. It tells you where you could win, not where you have won.
Bottom line: SOV in SEO is evolving, but the fundamentals hold. Track it smartly, question your tools, and always connect it back to your real business goals.
Share of Voice vs. Share of Market: How Metrics Drive Growth
Visibility vs. Market Share: Why Both Metrics Matter
Ever felt like your brand is everywhere, but sales just won’t budge? Or maybe you’re dominating the market, but the buzz around your name is fading? That tension—between how visible you are (Share of Voice, SOV) and how much you actually sell (Share of Market, SOM)—is at the heart of real marketing growth. Let’s break down why both metrics matter, how they interact, and what you can actually do with this knowledge.
What’s the Difference? SOV vs. SOM in Plain English
Share of Voice (SOV): Measures your brand’s visibility—how much of the “conversation” or media spending you own compared to your competitors. Think: your slice of all ads, organic search results, social mentions, or PR in your market.
Share of Market (SOM): Your actual market share. In other words, the percentage of total category sales or revenue that goes to your brand.
SOV is about attention; SOM is about results. One is the stage, the other is the applause.
The Growth Rule: SOV > SOM = Growth
Here’s the kicker: decades of research, including Binet & Field’s landmark study (nielsen.com), show a strong correlation between SOV and SOM. If your SOV is higher than your SOM—what’s called Extra Share of Voice (ESOV)—you’re setting yourself up for growth. Specifically, for every 10% your SOV exceeds your SOM, you can expect about 0.5% annual market share growth. Flip side: if your SOV lags behind, market share usually shrinks.
How to Use SOV and SOM in Practice
Let’s make this actionable. Here’s the logic we use when advising brands:
If SOV > SOM: You’re likely to grow market share (assuming your creative and targeting aren’t terrible).
If SOV < SOM: Watch out—competitors may catch up, and your market share could erode.
If SOV ≈ SOM: You’re maintaining your position, but not pulling ahead.
If SOV is much higher, but SOM doesn’t move: Check for wasted spend, poor creative, or wrong channels.
Table: SOV/SOM Scenarios and Likely Outcomes
SOV vs. SOM | Typical Outcome | What to Do Next |
SOV > SOM | Market share grows | Double down, but watch efficiency |
SOV < SOM | Market share declines | Reinvest or rethink visibility |
SOV ≈ SOM | Market share stable | Optimize for efficiency |
High SOV, flat SOM | No growth | Audit creative, targeting, channels |
Common Pitfalls and Watchouts
Mistaking SOV for impact: SOV tells you if you’re in the game, not if you’re winning. Don’t confuse visibility with effectiveness.
Ignoring channel mix: SOV in one channel (say, paid search) won’t save you if competitors dominate elsewhere. Measure across all relevant surfaces—organic, paid, social, even AI search (see our AI ChatGPT Visibility guide).
Short-term thinking: SOV lifts SOM over time, not overnight. If you’re expecting instant results, you’ll be disappointed.
The Takeaway
If you want to grow, keep your SOV above your SOM—and track both over time. But don’t just throw money at the problem. Audit your creative, your targeting, and your channel mix. And always ask: is my visibility translating into real business results?
Common Pitfalls and Misconceptions: What SOV Won’t Tell You
Navigating SOV’s Blind Spots: Where Marketers Trip Up
Ever stared at a rising share of voice (SOV) percentage and thought, “We’re crushing it!”—only to see no bump in leads, sales, or even brand buzz? You’re not alone. SOV is powerful for benchmarking your media spending and presence against competitors, but it has some real blind spots. Let’s break down where things go sideways, so you can avoid costly missteps.
SOV Isn’t a Shortcut to Impact or Awareness
Here’s a critical point: SOV is about how much you spend, not what you achieve. According to nielsen.com, SOV measures your media spending as a percentage of the total in your category, market, or channel. It doesn’t track exposures, views, likes, or even brand conversations. So if you crank up your ad budget but run bland creative, your SOV goes up—but your brand awareness or sales might not budge.
Think of SOV as measuring your “ticket to play,” not your score. You can outspend everyone and still lose if your messaging, timing, or targeting are off. For real campaign impact, you’ll need additional metrics—brand lift, conversions, or share of market (SOM).
Channel Overlap: The Double-Counting Trap
It’s tempting to sum up your SOV across paid, organic, and social to get a “total visibility” number. But beware: audiences overlap. Someone who sees your Instagram ad might also Google your brand and click an organic result. If you count both, you risk inflating your true reach.
What works: Track SOV by channel, but don’t add them up blindly. Instead, analyze how channels influence each other—does a spike in paid SOV drive organic search up, or vice versa?
Ignoring Market Context: SOV Alone Isn’t the Full Story
A rising SOV in a shrinking category isn’t a win. If the overall market is contracting (think: DVD rentals in the age of streaming), your “bigger slice” might be of a much smaller pie. Likewise, when a new competitor enters or consumer behavior shifts (like the rise of AI search), your SOV can drop even if your absolute spend stays flat.
Tip: Always layer SOV with market trend data. Ask: Is the market growing, stable, or shrinking? Are there new surfaces (like AI Overviews) where your brand needs presence?
Limits for New Brands and Micro-Niches
If you’re launching a new brand or operating in a hyper-specific niche, SOV can mislead. With low total spend in your category, a modest budget might give you a high SOV—but little real-world impact. Or, if competitors aren’t active in your exact micro-segment, your SOV could look artificially high.
Actionable check: For new or niche brands, use SOV as a directional metric, but validate with real-world signals—search demand, social mentions, or actual lead flow.
Bottom Line: SOV Is a Starting Point, Not a Finish Line
Don’t let a shiny SOV number lull you into a false sense of security. Use it to benchmark your competitive presence, but always ask: “Is this translating into meaningful outcomes?” Layer SOV with impact metrics, understand channel overlap, and keep an eye on market context. That’s how you turn visibility into real business results.
How to Improve Your Share of Voice: Actionable Steps and Channel Tactics
Ever felt like your brand is shouting into the void—lots of effort, but barely a ripple in the market? You’re not alone. Most teams hit a wall: they measure their share of voice (SOV), see a number, and then wonder, “Now what?” Here’s how we move from static measurement to real, practical growth—across the right channels, with the right levers.
1. Audit Your Current Share of Voice—Channel by Channel
Start with a clear-eyed audit. Don’t just look at one channel; SOV is only meaningful when you see the full landscape. For each channel—organic search, paid advertising, social media, PR—calculate your SOV using the basic formula: (Your brand metric ÷ total market metric) × 100 For example, if you have 2,000 social mentions and the total industry has 40,000, your SOV is 5%. But here’s the catch: metrics differ by channel. In SEO, it’s about Google results and keyword visibility. In paid, it’s impression share or media spending. Social? Mentions and engagement. PR? Media coverage volume. If you skip this granularity, you’ll miss hidden weaknesses.
2. Pick Your “Battlegrounds”—Don’t Spread Thin
Not all channels are equal for every brand. If organic search still drives over 90% of discovery (see BrightEdge AI Market Pulse), that’s your main battlefield. AI search is growing, but as of 2026, it’s still a discovery layer—less than 1% of referrals. Social might matter more in consumer verticals; PR in B2B or regulated markets. If your SOV is lagging in a channel that actually drives conversions for your category, that’s where to focus. Otherwise, you risk burning budget for little impact.
3. Channel Tactics: What Actually Moves the Needle?
Organic Search (SEO):
Expand and update content to cover more relevant keywords.
Build high-quality backlinks—don’t chase quantity; focus on relevance.
Monitor AI Overviews and optimize for inclusion, but remember: Google results still dominate for conversions.
Paid Advertising:
Increase media spending if your SOV is below your market share (SOM).
Refine targeting—sometimes, reallocating budget to high-intent audiences is more effective than just spending more.
Watch for diminishing returns: more spend doesn’t always equal more market share if creative or targeting is off.
Social Media:
Boost engagement, not just post volume.
Use social listening to find and join relevant conversations.
Collaborate with micro-influencers if your brand is niche.
PR & Media:
Target industry publications and thought leadership opportunities.
Track share of voice in earned media, not just paid placements.
4. Where to Pull Which Lever
If your organic SOV is high but conversions are low, check for intent mismatch or weak landing pages.
If paid SOV is low and competitors are outspending you, consider a budget shift—but only if the channel converts.
If social SOV is stagnant but your audience is active there, invest in community-building and real dialogue, not just scheduled posts.
5. Common Pitfalls (and How to Avoid Them)
Don’t chase every channel. Focus where SOV growth will actually move revenue.
Avoid vanity metrics. High social mentions mean little if they don’t translate to awareness or intent.
Don’t ignore the overlap: a spike in AI search SOV may not mean much if you’re invisible in organic results where users actually convert.
In short: Audit, focus, and act with intent. Improving share of voice is less about shouting louder everywhere, more about being heard in the places that matter most.
Trust Signals: Tools, Proof, and Real-World Application
Let’s be honest: when you’re trying to get a grip on your share of voice, the last thing you want is another black-box tool promising the moon. What actually matters? Trust—both in the data, and in the vendors behind it. Here’s where reality checks in.
What Makes a Share of Voice Tool Trustworthy?
There are dozens of platforms out there, but only a handful are recognized by seasoned marketers. BrightEdge, Targos and Brandwatch stand out for a reason: all have a track record, transparent methodologies, and clear documentation.
But a logo isn’t enough. A credible SOV tool should offer:
Channel granularity: Can you break down SOV by organic search, paid, social, PR, and AI search?
Competitive benchmarking: Does it show your SOV side by side with named competitors, not just “industry averages”?
Source transparency: Are the data sources and calculation methods clear?
Historical tracking: Can you spot trends, not just take snapshots?
Export and integration: Is it easy to pull your numbers into real reports, or are you stuck in a walled garden?
Frequently Asked Questions (FAQ) About Share of Voice
What exactly does Share of Voice (SOV) measure?
Let’s clear up a common misconception: SOV isn’t about how “loud” your brand seems, or how many people saw your ad, or even how much buzz you’re getting on social. SOV, in its classic form, is a hard number—your brand’s media spending as a percentage of all media spending in your chosen market, channel, and timeframe. For example, if you spend 100,000 euros on TV ads in Berlin in May, and all brands together spend 1 million, your SOV is 10% for that slice. It’s not about outcomes, exposure, or engagement; it’s about whether you’re even showing up to compete. In digital, the same logic applies—SOV can reflect your share of search visibility, paid ad impressions, or social mentions, depending on the channel.
Can SOV be compared across channels?
Short answer: not directly. Here’s why. SOV is always a percentage, but the underlying metric changes—media spend for TV, impressions for paid search, mentions for social, and so on. Comparing your 15% SOV on Instagram to your 20% in Google organic search is like comparing apples and oranges. Each channel has its own dynamics, audience, and competitive landscape. In practice, you track SOV within each channel to spot gaps or over-investment, then look for patterns across channels. If you want a more holistic view, you can try aggregating, but the numbers will always be a rough guide, not a precise map.
How often should you track SOV?
This depends on your goals and the volatility of your market. For fast-moving channels like paid search or social, weekly or even daily tracking can make sense—especially during campaigns or peak seasons. For slower channels (think TV, PR, or organic search), monthly or quarterly is usually enough to spot trends. The key is consistency: pick a cadence you can sustain, and stick with it. Don’t fall into the trap of tracking obsessively if you’re not ready to act on the data. And remember, SOV is a leading indicator—it tells you if you’re in the game, not if you’re winning.
Does SOV matter for small businesses?
Absolutely, but with a caveat. Small businesses rarely have the budget to dominate SOV in broad markets. But SOV is flexible: you can define your “market” as tightly as you like—say, “Instagram in my city this month” or “Google results for three core keywords.” The trick is to pick a competitive set and surface where you can realistically make a dent. For small brands, a focused, local SOV can be more actionable than chasing national numbers. And as research shows, even a small “extra SOV” (spending or visibility above your current market share) can drive growth over time.